
The starry sky, images of the glowing blue Earth or the latest colour images taken by the Mars rover Perseverance – space first triggers visual images in many people. This is probably because astronomy is primarily a visual science, despite the fact that most data collected in modern observational astrophysics isn’t visible to our eyes.
Dr Garry Foran is an astrophysicist who does research on the early universe at Swinburne University in Melbourne. He is visually impaired and uses a technique called sonification to listen up to twelve billion years into the past, deciphering the formation and the development of distant galaxies. In his interview with fortytwomagazine, he explains his research and speaks about the advantages of sound in data analysis and astrophysics.
fortytwomagazine: Dr Foran, what exactly is sonification and how does it work?
Dr Garry Foran: Sonification is the process whereby data (or a visual object on a screen) is converted to sound in a way that preserves, transmits and even enhances the information content. Depending on the application, this can take many forms and have many levels of complexity. Sonification is now finding applications ranging from education and outreach all the way through to professional level research.
Importantly, the use of sonification is not limited to improving accessibility for blind and visually-impaired people. It is well known that the use of a multi-modal sensory approach can enhance any interaction with data compared to using only visual means.
What kind of information is “sonifiable”?
Although astronomy is often thought of as a very ‘visual’ science, the truth is that modern observational astrophysics exclusively use digital data collected from objects invisible to the naked eye and/or at wavelengths outside our visual range. Accordingly, any images we see on a screen or published in the media are produced from streams of 1s and 0s. This means, almost any data can be rendered as sound if appropriately transformed.
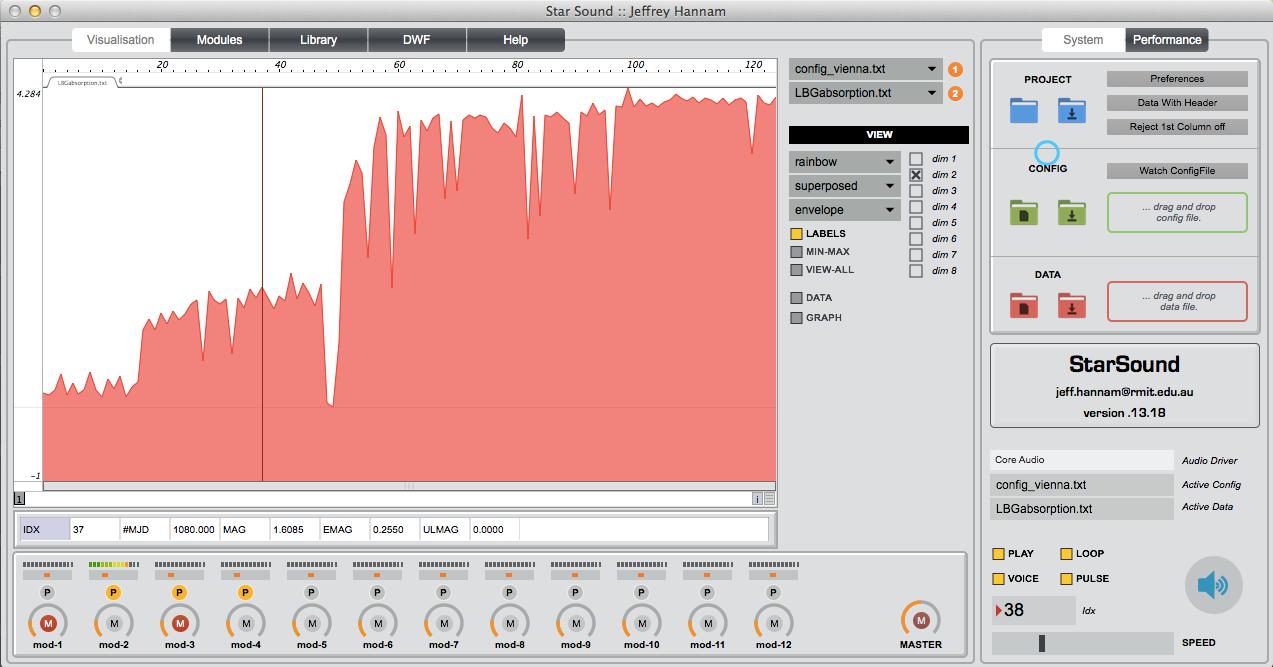
An example of sonification: a Lyman-alpha in emission (you can hear a peak corresponding to an increase in intensity of light) above you can see a visualization of the same data.
Image and audio: curtesy of Dr Garry Foran, Swineburne University
Does sound hold more or different information about the universe than visualizations?
Sound does have advantages over sight in some situations, and if wisely employed, can truly add a new important dimension even for mainstream applications.
One of the common features of modern astronomy and astrophysics is that, especially when you’re working with galaxies and objects, very, very, very far away, the data is often very noisy. It’s not a straight line. The Lyman-alpha or any other spectral feature that you’re looking for is often buried in noise. It can sometimes be hard to identify, especially by eye. But sound has an advantage over visualization in that respect. We call it the cocktail party effect:
If I was in a room of people and everyone in the room was speaking German, and I’m a native English speaker. Then if somebody else was speaking English on the other side of the room, my ear could pick up that sound of English, pick it out of the noise that would normally not be audible. Because my audio perception is tuned into the sounds of English, I can hear it even at a very low level, in a noisy environment.
Furthermore, we have a faster reaction time to sound. You see that in warning systems. They are usually given as an audio warning first, as well as a visual warning, because we react faster to an audio signal than we do a visual signal. So you could imagine applications where time is important, especially when you’re dealing with the real time analysis of lots of data. The ability to hear a sound in a noisy environment and respond to it quickly could often be important.
Another advantage is what we call temporal resolution. To put it differently, when there is a lapse of time between two sounds, we can hear two events more closely separated in time than our eyes can see them. If there are multiple events happening in a sound space, our ears can split them up down to the tens of microseconds timescale. Whereas our eyes are relatively slow. If you think of a TV screen or an old-fashioned movie screen, it’s like 25 frames a second, and our eyes can’t see the difference. It just looks like a smooth image, but our ears could hear that lapse very, very easily.
So we would be foolish not to include sound in our discovery of space?
I think in the past, we have been guilty of just relying on our eyes and visualization techniques to try and extract information from images.
It’s easy to forget when you look at a computer screen, you’re just looking at a flattened, two-dimensional image of a three-dimensional object. You’ve squashed information into a single plan that is really an object with height and width and depth. It is not surprising therefore that information can be lost or overlooked by limiting oneself to a 2D image only. You can hear a sound and you know whether it’s come from in front of you, behind you, above you or below you, whereas your eyes are pretty much just looking straight ahead. Especially the high resolution part of your sight. But sound, you can tell all around you.
If you have extra information on an object, which you usually do, especially if the object has been observed with many different telescopes and at different energies and if that information can be encoded in sound and interpreted at the same time as the visual information, you certainly make your experience much more realistic. That’s the way we’re designed to function. In fact, we have multiple senses for that very reason.
How do you explore galaxies that are so distant from us in space and time?
While modern telescopes and instrumentation can reveal the structure and properties of galaxies in exquisite detail, there are still limits to the depth and scale over which these can be employed.
The main aim of my research is to develop methods by which such capabilities can be extended using the so-called Lyman-alpha line — the brightest feature in the spectrum of early star-forming galaxies. In my work, I measure the strength of the Lyman-alpha feature and its relationship to other galaxy properties and apply statistical methods to predict the properties and structure of galaxies where Lyman-alpha is all we have.
I take groups, collections, populations of galaxies that are a little closer, where other astrophysicists have measured mass, size and shape and other properties including the Lyman-alpha. Then I look for the relationship between those properties and Lyman-alpha.
My fellow astrophysicists use a very wide range of energy. They might work with multiple telescopes and data sets. They look at the light coming from a galaxy, at everything from ultraviolet through the visible into the infrared, the radio, even x-ray and gamma ray. When you have all that energy information, you can then plug that into the laws of physics and you can model the star population, the age of the stars, the star formation rate, the evolution of the galaxies.
When you go to parts of the universe where you can’t measure anything except Lyman-alpha, because it’s so strong, you can say: “Oh, well, because of the Lyman-alpha-line looks like this, then the other properties are probably, these other things.” My project is about building those relationships.
What exactly is the Lyman-alpha line?
The reason why Lyman-alpha is important is that it comes from hydrogen. 99% of the universe is hydrogen. Now there are different forms of it: There’s molecular hydrogen, atomic hydrogen, and there’s ionized hydrogen. So if there is something we can measure that tells us about that hydrogen, then we’ve got a good chance of finding out what’s going on in that particular spot.
Stars, especially when they’re new, they create a lot of ultraviolet, very high energy light. The ultraviolet is only very strong in young, very big stars. Now that ultraviolet light is energetic enough to ionize hydrogen. That means the hydrogen atoms are bumped up to a higher energy level and when they relax from that level, which they do straight away, you get a Lyman-alpha-photon. So Lyman-alpha is just the name of that light which has a fixed energy level. It’s always the same energy. That’s why we know where to look for it and how to identify it. Not only does it come from hydrogen, which is everywhere in the universe, in stars and galaxies, and even in the space between galaxies, the intergalactic medium, but it’s also very strong. It’s the strongest line, the strongest peak in the spectrum. It helps us to see right back to the very earliest times of the universe when galaxies were first forming.
The sonification of a Lyman-alpha absorption (you can hear the spectrum dip down at the Lyman-alpha position).
Audio: curtesy of Dr Garry Foran, Swineburne University
What techniques do you use to analyse Lyman-alpha and to explore galaxies?
The light from early galaxies can be split into different wavelengths in the same way that the light from the sun can be split into a rainbow. When we do this, we call that trace of intensity versus wavelength a spectrum, and the study of these is called spectroscopy. The spectrum contains peaks and troughs that tell us about the physics of the galaxy including such properties as their mass, age, rate of star formation and even the way the stars and gas in the galaxies are moving.
For the most distant galaxies i.e. those from the earliest epochs, the light is very faint and even with the largest telescopes, most of the peaks and troughs of interest in the spectrum are lost in the background noise. The Lyman-alpha line is usually the brightest peak in the spectrum and often the only information available.
The spectrum is just a line, the line that goes up and down. I use the simplest form of sonification to analyse it. I just read that data in, I look at two columns of numbers. One column is the energy column. And the other column is the intensity of the light.
Interview by Ella Steiner
About
Dr Garry Foran is an Australian astrophysicist studying galaxies in the early universe, known as “high redshift” galaxies, at the Swinburne University of Technology in Melbourne. He uses spectroscopy to learn more about the properties of those galaxies.
Dr Foran who lost his sight to a degenerative retinal condition is also active in a collaboration that is developing sonification tools, so far two software packages: “vox megellam” and “starsound” that facilitate the management and analysis of astrophysical data using sound.